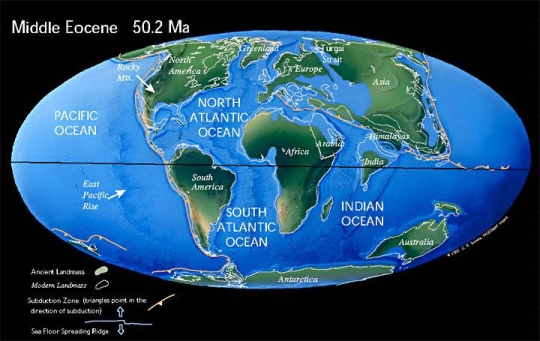
Fig. 1 – Distribution of continental land masses during the
Middle Eocene era (50.2 Ma before present) (Scotese, 1997)
Updated: Dec 09, 2024
Jnana R. Kayal
The Indian sub-continent is currently moving northward at about 40 mm/year and colliding with the Eurasian Plate (Tibetan Plateau). The collision with Asia began in the Middle Eocene era about 50-55 Myr ago (Figs. 1 & 2).
Fig. 1 – Distribution of continental land masses during the
Middle Eocene era (50.2 Ma before present) (Scotese, 1997)
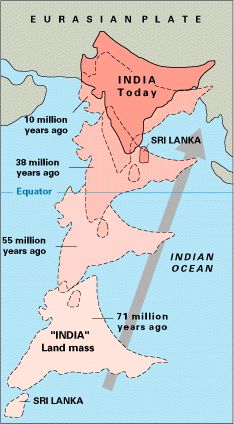
Fig. 2 – Plate tectonic movement of India northwards
into the Eurasian Plate over the last 71 Myr (US Geological Survey)
The region of north India is seismically very active. Major earthquakes pose a continuing threat to communities of that region. In addition, there is intra-plate earthquake activity south of the Himalayan Front that poses a threat to communities in other parts of the country, in particular in west India.
Peninsular India constitutes one of the largest Precambrian shield areas of the world (Fig. 3). The Indo-Gangetic Alluvium Plain (IGAP) separates the Himalaya to the north and the Peninsular Shield to the south (Figs. 3 & 4). The Shillong Plateau in northeast India constitutes an outpost separated from the main shield by the Bengal Basin and from the Himalaya by the Brahmputra River.
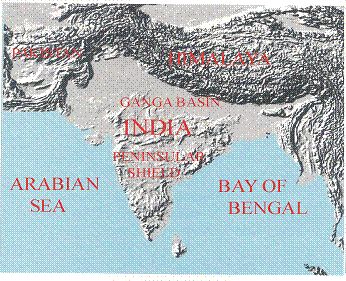
Fig. 3 – Topography of the Indian sub-continent, Tibet, Pakistan and Bangladesh
The Peninsular Shield of India is made up of three main cratonic regions (Fig. 4); the Aravalli, the Dharwar and the Singhbhum which are separated by Proterozoic rifts and mobile belts. The major prominent rifts that separate the southern and northern blocks of the shield are the Narmada Son Lineament (NSL) and the Tapti Lineament (TL), together called the Son-Narmada Tapti lineament (SONATA). The other rift basins are the Kutch, Cambay, Godavari, Cuddapah etc. (Fig. 4).
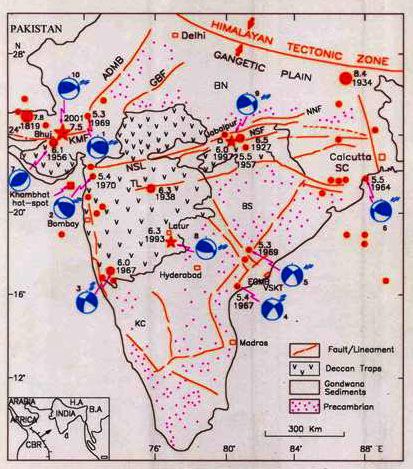
Fig. 4 – Seismo-tectonic map of India
The Himalayan region is very much associated with a high degree of seismicity in comparison to that of Peninsular India (Fig. 5), and making the Himalayan region seismically more vulnerable to earthquake damage (Zone V) than that of Peninsular region (Fig. 6).
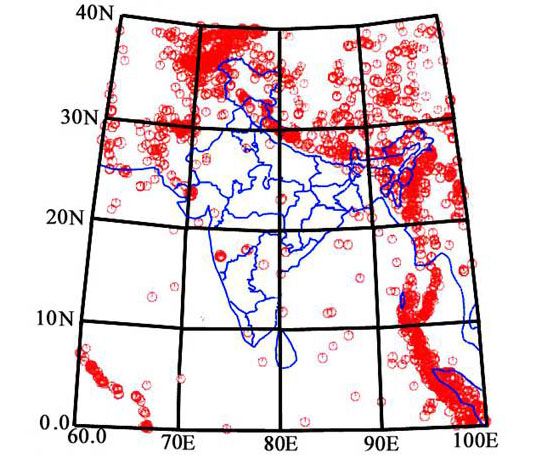
Fig. 5 – Seismicity of the Indian sub-continent, 1964-2002 (Magnitude > 5.0).
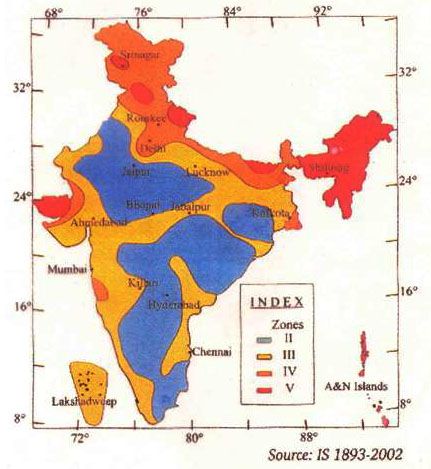
Fig. 6 – Seismic zonation within India.
To gain a better understanding of the crustal architecture of India and the threats posed by earthquakes, the Geological Survey of India (GSI) has, in recent years, determined 3-D seismic velocity structure in different parts of the Himalayan region and in Peninsular India using seismic inversion techniques with the P- and S-wave arrival times recorded by local and regional seismic networks. The aftershock sequences of recent damaging earthquakes (1993 Killari earthquake, Mw 6. 3; 1999 Chamoli earthquake, Mw 6.3; the 2001 Bhuj earthquake, Mw 7.7) have been studied in more detail to provide seismic crustal images of the earthquake source areas.
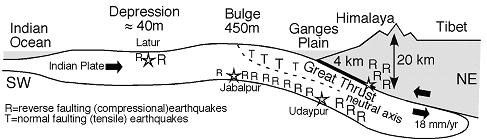
Fig 7 – Buckling of the Indian sub-continent as it collides with the Tibetan Plateau (Bilham, 2004)
The northeast Himalayan region of India is one of the most seismically hazardous zones in the south Asia. GSI has determined the 3-D seismic velocity (Vp) structure of the crust of that region using selected arrival time data from two groups of shallow to intermediate-depth local earthquakes recorded by two different seismic networks (Fig. 8) by applying the 3-D tomography method of Zhao et al. (1992).
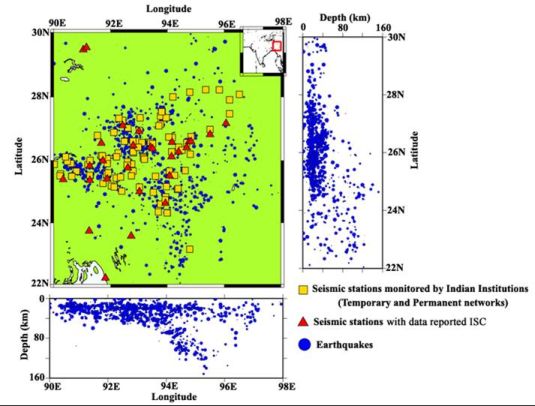
Fig. 8 – Seismicity and recording networks in northeast India.
One group of earthquakes consisted of 1011 shallow and intermediate-depth local earthquakes recorded during 1984-2000 by 113 temporary and permanent seismic stations in NE India (Figure 8). The other group of earthquakes consisted of 169 shallow to intermediate-depth earthquakes that occurred from 1964 to 2000 and were reported in International Seismological Center (ISC) Bulletins. These earthquakes were recorded by a network of 29 seismic stations (Fig. 8).
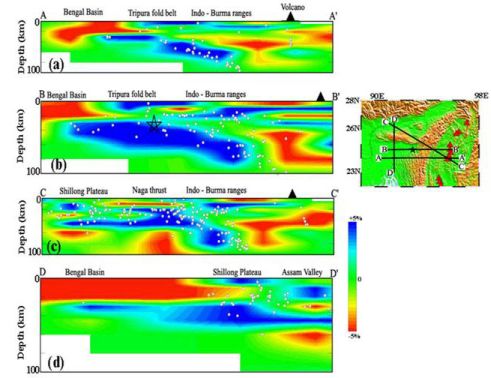
Fig. 9 – Lithospheric velocity profiles under northeast India.
red = low P-wave velocity regions. blue = high P-wave velocity regions.
white dots = earthquakes.
The interpreted cross-sectional velocity images of the lithosphere in NE India (Fig. 9) demonstrate a good correspondence to the local and regional tectonic structures (Fig. 10) (Mishra et al., 2005a). The low-velocity zone down to 20 km depth in the region of the Bengal Basin corresponds to the thick sediments within the Bengal Basin, while high-velocity anomalies in the same depth range possibly indicate the presence of dense crystalline rocks under compressional stress that cause the seismicity in the region. The subducted Indian lithosphere is imaged as a high-velocity zone beneath the Burma platelet (Fig. 9).
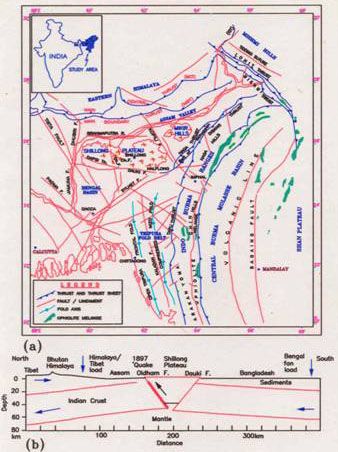
Fig. 10 – Tectonic map of Northeast India.
Kayal and Zhao (1998) imaged 3-D seismic velocities Vp and Vs, and the Poisson's ratio structures using microearthquake data recorded between 1983 and 1986 by a local seismic network (Fig. 11), which support the regional tomographic results of Mishra et al. (2005a) (Fig. 9).
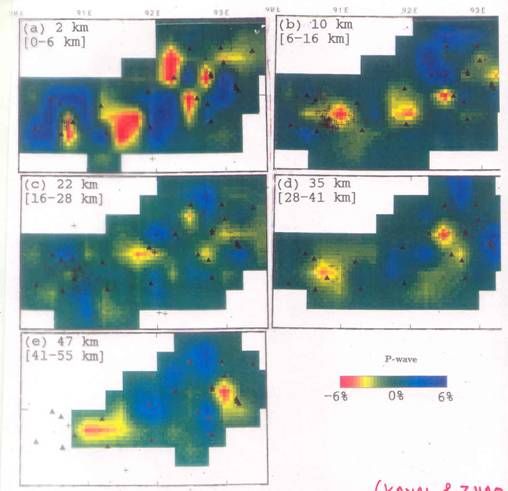
Fig. 11 – P-wave velocity variations at 2 km, 10 km, 22 km, 35 km and 47 km depths
under northeast India (Kayal & Zhao, 1998)
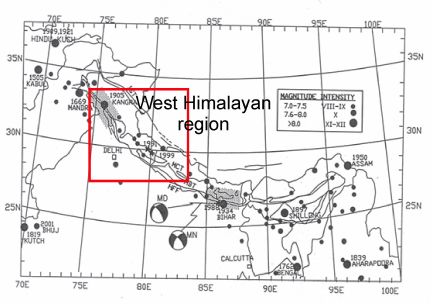
Fig. 12 – Major earthquakes of the West Himalayan Region.
In the western Himalayan region, a detailed 3-D seismic image determined by Mukhopadhyay and Kayal (2003) beneath the 1999 Chamoli earthquake (M 6.3) epicenter area (Fig. 12) clearly shows that the major thrust zones; the mainshock and its aftershocks were in high-Vp zone of the "fault end" (Fig.13).
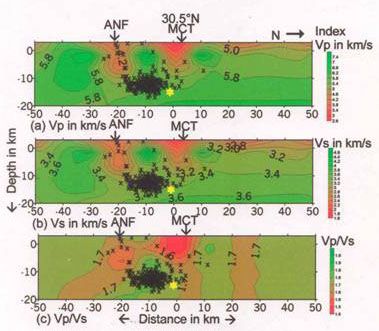
Fig. 13 – Seismic tomographic images (profiles) across the Chamoli area
of the western Himalayan region. MCT = Main Central Thrust.
Recently, Mishra et al. (2005b) determined a high-resolution 3-D P-wave velocity structure in the western Himalaya using P- and S-wave phase arrival data from a total of 1042 earthquakes consisted of 534 aftershocks of the 1991 Uttarkashi and the 1999 Chamoli mainshocks recorded by local temporary and permanent seismic stations, and 508 earthquakes reported by ISC bulletins (Figs.12, 14). This study revealed high velocity structures at source areas of the 1905 Kangra earthquake (M 8.0), the 1991 Uttarkashi earthquake (M 6.4), and the 1999 Chamoli earthquake (M 6.3) (Fig.15).
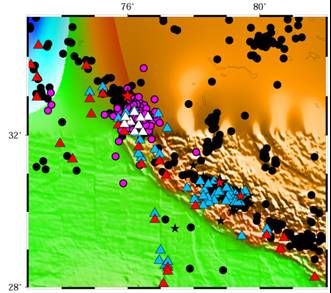
Fig. 14 – Earthquakes and seismic recording networks used to determine
the P-wave velocity structure of the crust under the Chamoli region of the western Himalayan region.
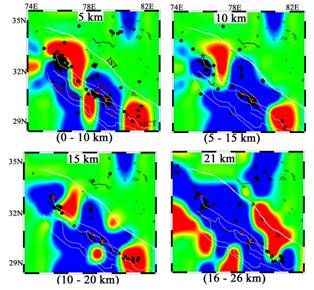
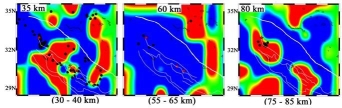
Fig. 15 – P-wave velocity variation "slices" at 5 km, 10 km, 15 km, 21 km, 35 km, 60 km and 80 km depth
under the western Himalayan region.
In Peninsular India, detailed seismic imaging has been done using P- and S-wave arrival times from the aftershock sequence of the 1993 Killari earthquake (M 6. 3) that occurred in the southern Archaean shield and using the sequence of the 2001 Bhuj earthquake (Mw 7.7) that occurred in the Kutch Rift Basin (Fig. 4).
The 1993 Killari Earthquake region: 3-D imaging of the 1993 Killari earthquake source area in central Peninsular India (Fig. 3) was done using the local earthquake tomography method of Thurber (1983). The seismic images show that the mainshock occurred at the boundary between a high and a low-Vp zone (Kayal and Mukhopadhyay, 2002) and it supports their intersecting fault model shown in Figures16 and 17.
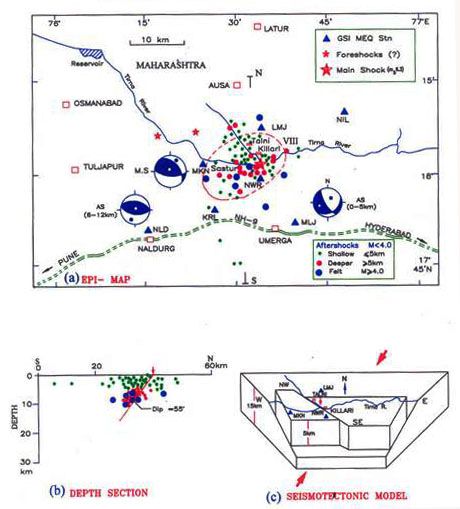
Fig. 16 – The 1993 Killari earthquake sequence in central Penisular India
and a seismotectonic model for the region.
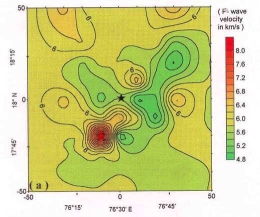
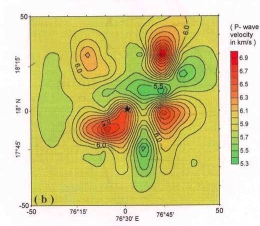
Fig. 17 – P-wave seismic velocity variation "slices" in the region of the 1993 Killari earthquake.
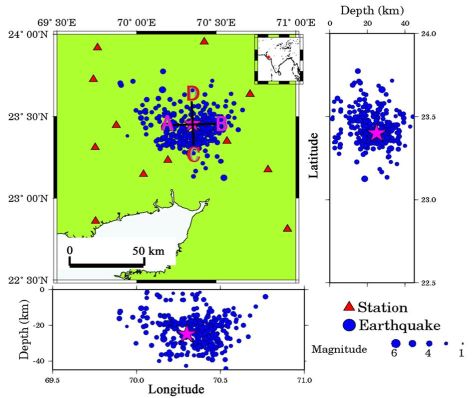
Fig. 18 – Aftershocks of the 2001 Bhuj earthquake in western India
and the seismic monitoring network used to determine images of the Earth's crust in the region.
The 2001 Bhuj Earthquake region: Kayal et al. (2002), Mishra and Zhao (2003), Mishra et al. (2005b) estimated a detailed seismic structure using high precision P- and S-arrival times from a total of the 368 aftershocks (Fig. 18) using 3-D tomography method of Zhao et al. (1992).
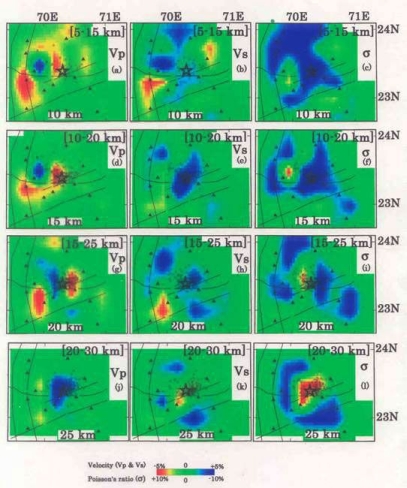
Fig. 19 – Depth slices showing P-wave velocity variation
under the Bhuj earthquake regions. Red = low Vp velocities; blue = high Vp velocities.
The lateral and vertical heterogeneities in the seismic velocities Vp and Vs, and in the Poisson's ratio(s) determined at the 2001 Bhuj mainshock hypocenter suggests that the mainshock was a fluid-driven earthquake (Figs. 19, 20).
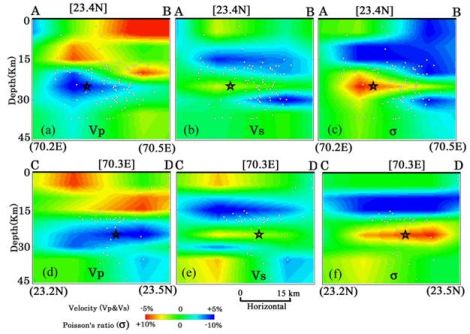
Fig. 20 – P-wave velocity, S-wave velocity and Poisson':s ratio profiles
across the region of the Bhuj earthquake (star).
The 3-D tomographic models are well correlated with a simulated model of the intersecting fault geometry derived from the fault plane solutions of the Bhuj earthquake sequence (Kayal et al., 2002b) (Fig. 21).
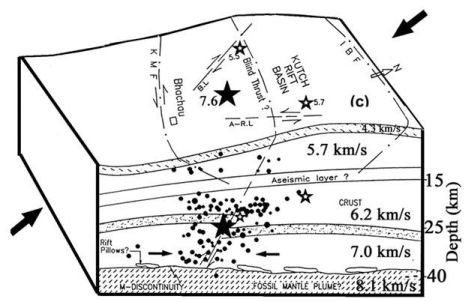
Fig. 21 – Tectonic model of the crust in the region of the Bhuj earthquake.
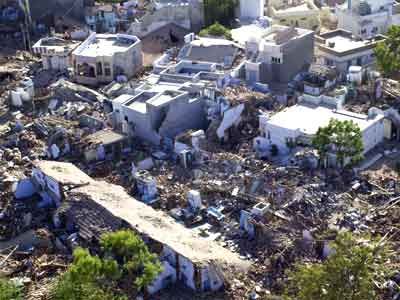
Fig. 22 – Bhuj earthquake damage, 2001
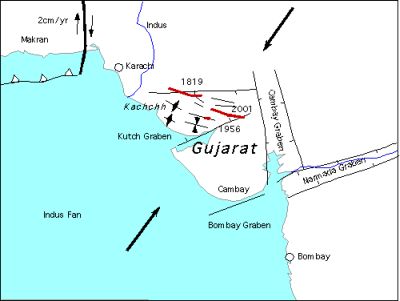
Fig. 23 – Simplified tectonic image of the Gujarat (Uni of Colorado)
Deep seismic sounding (DSS) investigations have been made by the National Geophysical Research Institute (NGRI) group in many different parts of India (Fig. 24).
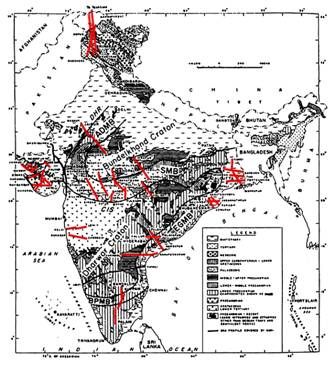
Fig. 24 – Location of deep seismic sounding (DSS) profiles throughout various regions of India
conducted by the National Geophysical Research Institute.
The results of the DSS investigations using seismic refraction and wide angle reflection techniques reveal many deep and shallow subsurface features within the Earth's crust (Figs. 25 - 27):
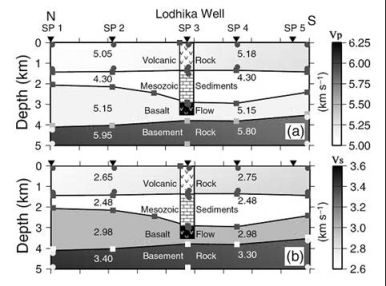
Fig. 25 – P-wave and S-wave seismic velocity profiles in the Lodhika Well area
showing sedimentary sequences beneath Deccan Traps.
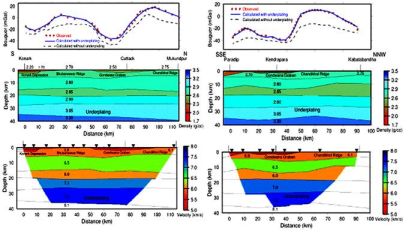
Fig. 26 – P-wave seismic velocity profiles across the SONATA zone
together with gravity modeling along the profiles.
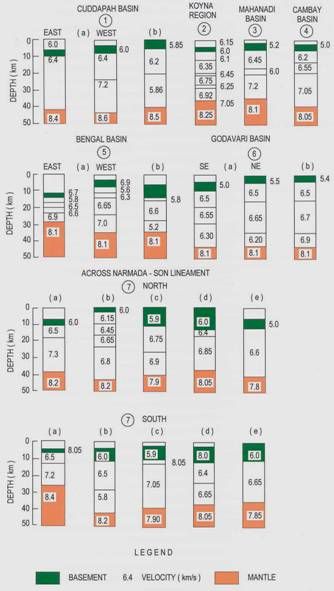
Fig. 27 – One-dimensional velocity/depth models from various regions of India.
Seismic receiver function (RF) studies have been conducted out using teleseismic earthquake waves recorded at 10 broadband stations spread over Peninsular India (Fig. 28) and 5 stations over the northeast India regions (Fig. 29).
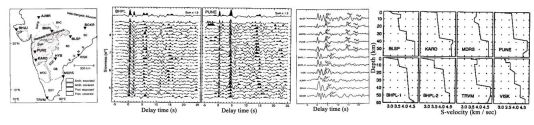
Fig. 28 – Results from RF studies across Peninsular India
showing S-wave velocity profiles of the crust.
A crustal thickness of 33-39 km is determined below the South India Archaean shield. The Deccan Trap basalts have not significantly affected the underlying crust. The predominant Proterozoic crust in the northern and eastern part of the shield, on the other hand, exhibits a complex character. The Moho conversions are considerably weaker compared to the Archaean terrains, and crustal thickness is 40 km and more (Kumar et al., 2001).
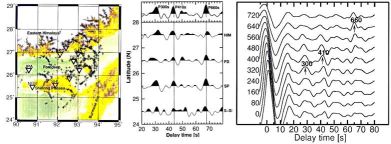
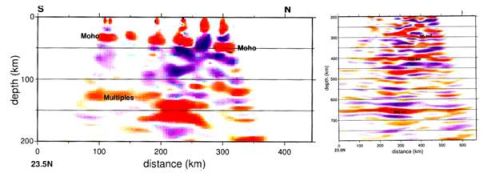
Fig. 29 – RF studies of the crust in Northeast India illustrating
the strong P-wave to S-wave energy conversion at the Moho.
In the northeast India region, thinner (33 km) Archaean crust is reported below the Shillong Plateau with the thickness increasing to ~40 km below the Brahmaputra valley and to ~50 km below the northeastern Himalaya to the north (Ramesh et al., 2005).
Behera et al., 2004, Journal of Geophysical Research, B12311, 1-25;
Bilham, R., 2004. Earthquakes in India and the Himalaya: tectonics, geodesy and history. Annals of Geophysics, 47(2), 839-858;
Kayal and Zhao, 1998, Bulletin of the Seismological Society of America, 88, 667-676;
Kayal et al., 2002a, Geophysical Research Letters; 29, doi:10.1029/2002GL015177;
Kayal et al., 2002b, Journal of the Geological Society of India, 59, 395 – 417;
Kayal and Mukhopadhyay, 2002, Bulletin of the Seismological Society of America, 92, 2036 – 2039;
Kumar et al., 2001, Geophysical Research Letters, 28, 1397 – 1405;
Mishra and Zhao, 2003, Earth and Planetary Science Letters, 212, 393 – 405;
Mishra et al., 2005a, Journal of Geophysical Research (Revised the MS);
Mishra et al., 2005b, Geological Journal of India (Revised the MS),
Mishra et al., 2005c, Geological Society of India, Special Publication, 85, 337;
Mukhopadhyay and Kayal, 2003, Bulletin of the Seismological Society of America, 93, 1854 -1861;
Ramesh et al., 2005, Geophysical Research Letters, (in press);
Sain et al., 2002, Geological Journal of India, 150, 820 – 826;
Scotese, C. R., 1997. Palaeogeographic Atlas, PALEOMAP Progress Report 90-0497, Department of Geology, University of Texas at Arlington, Texas, 37 pp.
Thurber, 1983, Journal of Geophysical Research, 88, 826 – 836;
Zhao et al., 1992, Journal of Geophysical Research, 97, 19909 – 19928.
J. R. Kayal,
CGD, Geological Survey of India
Kolkata, India
jr_kayal@hotmail.com